UPDATE OF 60/40 VERSUS 50/50 RISK PARITY—-3/17/2020
Maybe there have been worst short-term results in markets sometime in history, but we have never seen this kind of sustained volatility and radical daily price changes since the 1930’s. This year’s performance is worse than the 3-month period in 1929 which included Black Monday and worse than the 3-month period which included October 1987. So, we thought it would be a good idea to update the performance of the MSR 50/50 Risk Parity Index of Stocks and Fixed income versus 60/40 to account for its comparative performance.
There have been five major equity “crashes” since 1929. They are 1929, 1987, 2000-2008 (2) and 2020. Depending on chosen start dates and end dates, the current “crash” is the steepest in the shortest period that we have been able to identify. But the question we want to explore is how well a risk parity approach to equities and fixed income have performed versus 60/40, a standard benchmark that is used by many. Pension Funds, however, as we discussed in our paper, tend to lean closer to 70/30 for the portion of the portfolio in the public markets—which would result in even more risky performance than 60/40. Our paper goes over this in detail for those who wish to review the concepts.
Our paper demonstrated that over the long run (1926-2019) Risk Parity of Stocks and Bonds outperformed 60/40 on a Risk adjusted basis, and through leverage exceeded returns with a lower volatility, and therefore a Higher Sharpe Ratio. The key result is that the unlevered Risk Parity portfolio virtually matches the Tangency Portfolio, and on a leveraged basis sits very close to the Capital Market Line. These are two portfolios which one cannot identify ex-ante. We provide an explanation why the 50/50 portfolio can achieve a result very close to the “after the fact” tangency portfolio, both on an unlevered and levered basis. We encourage you to review this.
But equally important to investors are the risk of significant drawdowns. A strategy which earns better results over the long run is preferable, of course, but if it comes attached to an expectation of more and larger left tail events, it can lose its appeal. We suggest this is not the case in our original essay and will seek to provide more evidence in this blog based on recent market performance.
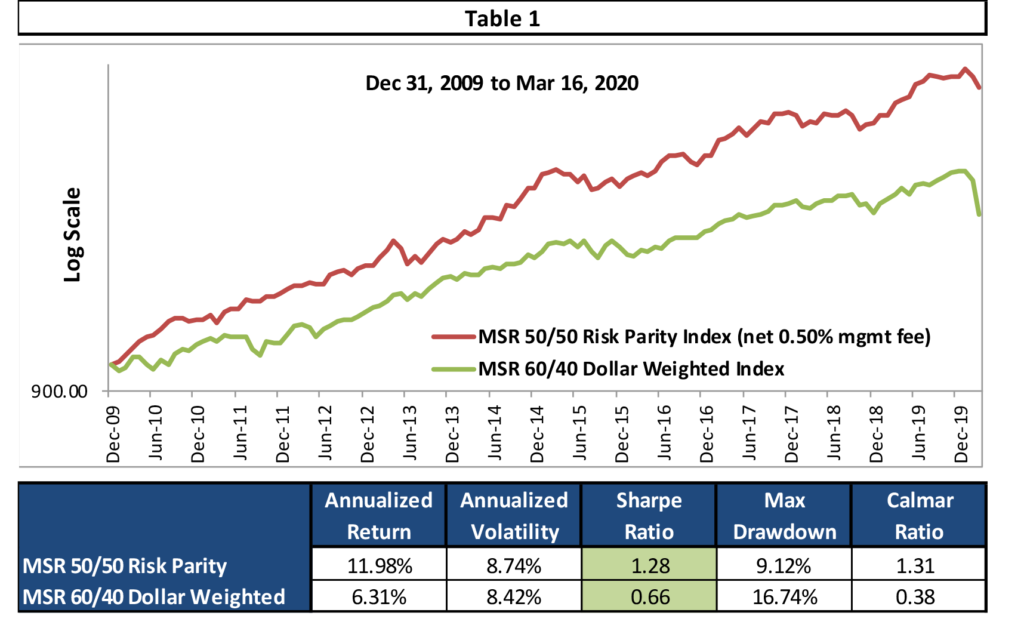
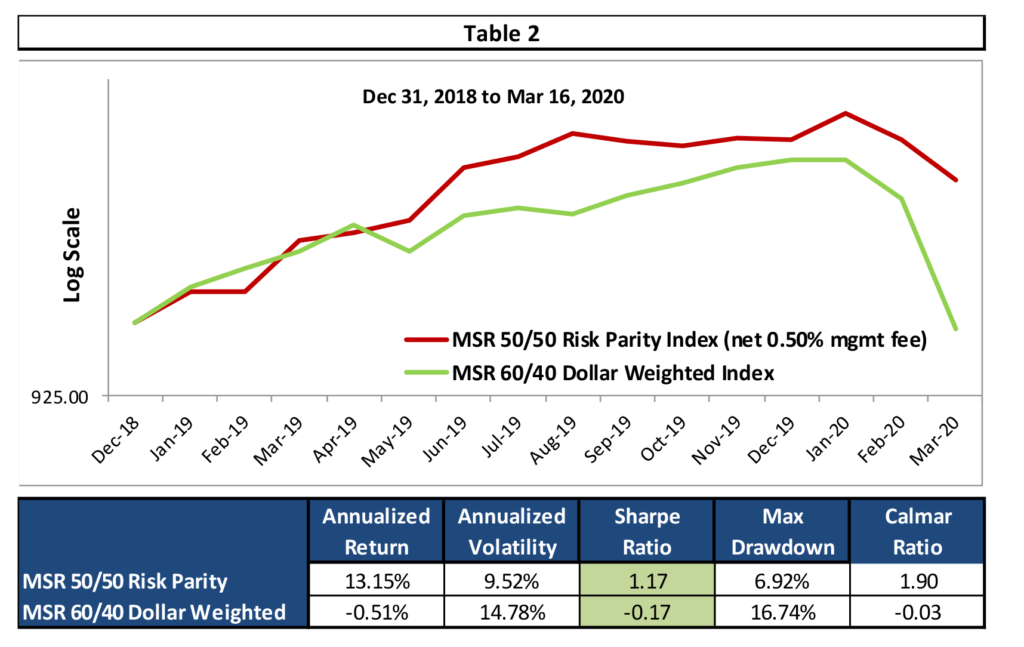
Both portfolios have the same instruments. The 60/40 portfolio allocates 60% of its notional weight to global equities consisting of 7 equal notionally weighted equity indices (S&P 500, Dow 30, NDX 100, FTSE 100, EuroStoxx 50, DAX, and Nikkei) and 40% to 8 equal notionally weighted Government Fixed Income Indices (US 2yr, US 5yr, US 10 year, US, 30 Year, 10yr Gilt, 2yr German, 5yr German, 10yr German). The MSR 50/50 Risk Parity Index equally risk weights the Equity and Fixed income portfolios (and also applies a 2% daily 2-sigma VaR limit), and within those portfolios, equally risk weights the instruments.
The following 2 tables compares results from 1) 12/31/09—-3/16/20; and 2) 12/31/18—–3/16/20 for each of these two portfolios. The time frame in Table 1 was chosen to capture the incredible bull market while the time frame in Table 2 was chosen to more heavily weight the recent sell-off) Risk Parity still clearly outperforms. From 2010, and from 2019 the Risk Parity Portfolio is virtually identical to the tangency portfolio.


We believe the evidence is clear that the proper benchmark for any stock and bond portfolio is the 50/50 risk parity portfolio—-and to ignore this is to underperform in the long run.